
7 Mile Advisors’ Ben Lunka and Neil Churman discussed the current M&A backdrop at our annual Access conference on October 16 in Charlotte. The following piece highlights the principal trends around current M&A activity, which Ben and Neil presented to industry leaders in attendance.
Overall M&A Market
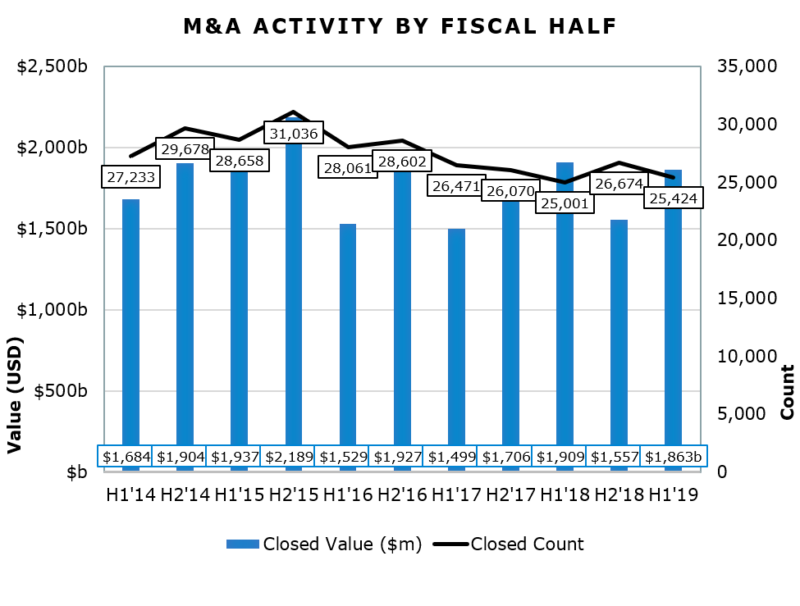
The overall M&A Market remains robust, particularly when comparing the first half of 2019 to the first half of 2018. As can be seen in figure 1 below, in terms of deal value in H1’19, it is slightly down compared to the same period in 2018, but deal volume is up to 25,424 compared to 25,001 in those same respective periods. The modest decline in deal value is due to the larger amount of megadeals completed in H1’18 compared to H1’19. Drivers for the increased deal count are numerous, but one is the motivation of sellers to transact before the likely looming recession, which may impact valuations.
See the figure below for an expansive view of the deal volume and deal value trends over recent periods.
Figure 1
Strong Balance Sheets
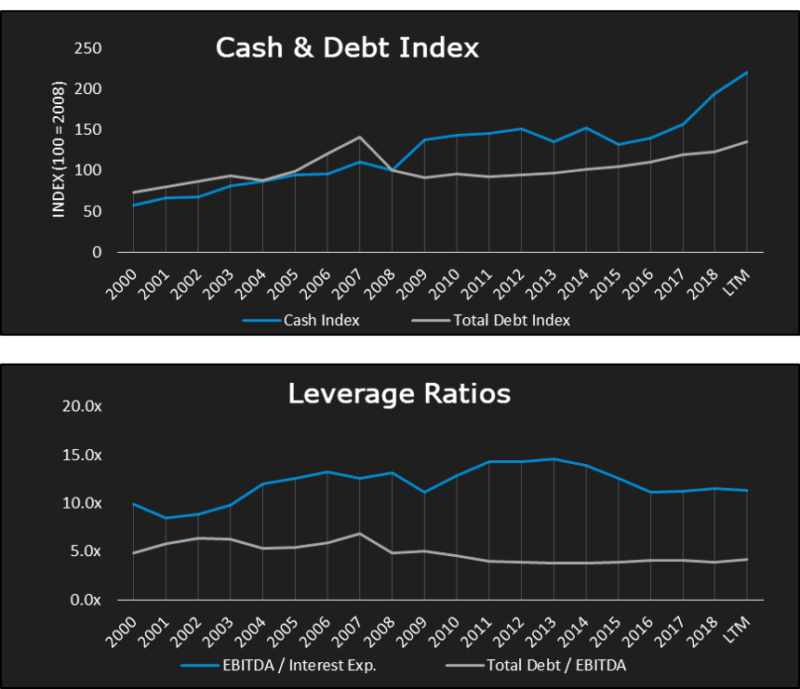
One of the primary reasons for why transactions continue at a healthy clip in 2019 is due to the strength of corporate balance sheets. As seen in figure 2 below, particularly compared to 2008 and beforehand, balance sheets have significantly more cash on hand and less debt. That fiscal position allows for buyers – especially strategic investors – to seek and make the right acquisitions without having to worry about being overly burdened with existing and new debt. As Ben pointed out at Access, “Firms previously operated at ~5.0x Total Debt to EBITDA and ~10.0x EBITDA interest coverage. Post-2008, these numbers migrated towards ~4.0x and ~13.0x, respectively, but have since receded.” The bottom line here is that there is a lot of dry powder sitting on the sidelines, oftentimes overseas, needing to be put to work.
Figure 2
Growth and Margin Movement
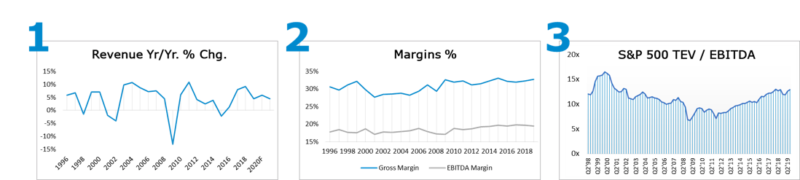
Growth rates for the S&P 500 Index are forecasted to dip in 2019 and 2020 compared to 2017-2018, and we also see a moderation of previous explosive growth in the lower middle market tech services segment. To be clear, the overall growth we see in tech services is still robust and depending on what specific pockets you look at (see AWS, Microsoft, ServiceNow, Adobe, Salesforce, etc. partners) you can still see exceptional growth. But overall, we have observed some growth moderation. In particular, we are aware of some clients of tech services firms, for instance, pushing consulting projects out one or two quarters. We believe that some of the broader market uncertainties around trade and geopolitical events may be contributing to these management decisions.
As you can see in the figure 3 below, in contrast to growth rates, margins have shown a consistent uptick and should continue to maintain this trend. The reasons for this trend also vary, but are largely due to internal initiatives to improve margins such as employing managed services models in IT services companies – a model that drives operating leverage and thus reduce overhead costs. We have also observed, as outlined in our IT Services companies’ Q2 ’19 quarterly earnings call report, IT services firms that are outsourcing more of their delivery to locations in LATAM are seeing a cut to their cost of sales and a boost to their bottom line. And in a separate, but related note, U.S. clients of these publicly traded companies are becoming more and more comfortable with the delivery of their projects being carried out in nearshore locations like LATAM. In turn, this growing comfort allows for even more delivery to be executed abroad.
Figure 3
IT Comps
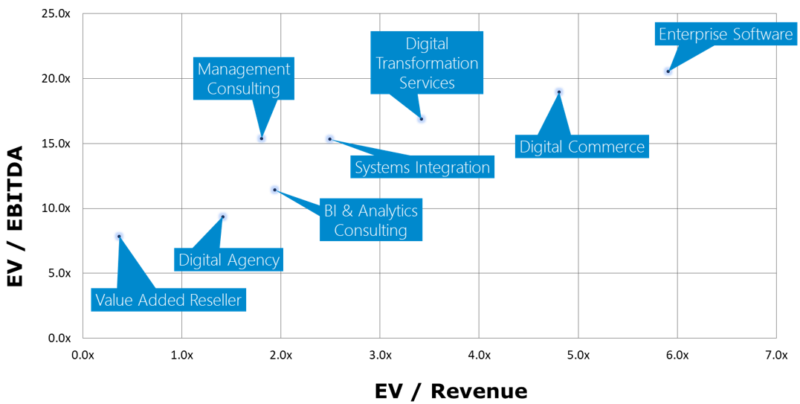
Another key exchange during this Access dicussion revolved around the trading multiples of publicly traded IT companies and how those multiples relate to privately held companies’ own valuations. As we can see in figure 4 below, the Enterprise Software category is far and away the most expensive – trading at close to 6X EV/revenue and over 20X EV/EBITDA. On the services side, companies with an offering geared towards Digital Transformation (broadly speaking), and BI & Analytics consulting are trading at the higher end of the range for IT services companies: around 2X-3.5X revenue. Firms focused on legacy technologies or pure-play Value Added Resellers are trading at the lower end of the range, roughly from .5X to 1X revenue. Therefore, it may be obvious to state, but for clarity, the more in demand your service offering is, both from a technical capabilities perspective as well as from a – as Neil Churman reflected at Access – “which technology partner you hitch your wagon to” perspective, will have a significant impact on how valuable your business is viewed. For instance, if you are working in the cloud services arena and have significant engineering talent focused on ServiceNow, you are a scarce resource given it is quite difficult to hire ServiceNow engineers. This business will likely trade well. There certainly is a correlation with how public companies are trading and where private companies will trade. Typically, there will be a discount attached to private companies compared to similar public companies and the exact discount will vary. And of course, for private companies, the drivers of value will be similar, but not exactly the same as for those of public companies, including: a strong management team, solid historical growth and more importantly, demonstrable growth forecasts, quality of revenue, strengths of the client base, etc.
Figure 4
Overall, Ben and Neil’s dialogue at Access held many more insights, but in order to get all those details please join us at 7 Mile’s next event, or simply get in contact with us. You can also view the full presentation here.
About 7 Mile Advisors:
7 Mile Advisors provides Investment Banking & Advisory Services to the Business Services & Technology Industries globally. 7 Mile Advisors advises on M&A and private capital transactions, and provides market assessments and benchmarking. As a close-knit team with a long history together and a laser focus on our target markets, 7 Mile Advisors helps its clients sell companies, raise capital, grow through acquisitions, and evaluate new markets. For more information, including research on the M&A markets, visit www.7mileadvisors.com.